Writing a B2 report means giving clear information and making useful recommendations. To do this well, your students need language for describing change and survey results. Once they have practised it a few times, they can use it to support their ideas in a report.
At B2 level, reports are one of the task types in Cambridge B2 First Writing Part 2. Describing change and surveys is useful practice for organising findings and explaining why a recommendation makes sense.

When writing reports, your students can use the charts provided in these worksheets as evidence. In a B2 First exam report, they should develop relevant findings that fit the situation in the task. However, you probably don’t want to be inventing specific statistics which are going to sound made up.
After all, 77% of statistics are 28% false.
An examiner also is not going to award points simply for including numbers. In fact, you can be penalised for irrelevancies, so make sure anything you write is connected to the graph provided or the topic of the report. However, there is a huge variety of language used to describe change, including some really juicy verb+adverb collocations, which might just grab an examiner’s attention if used well.
Contents
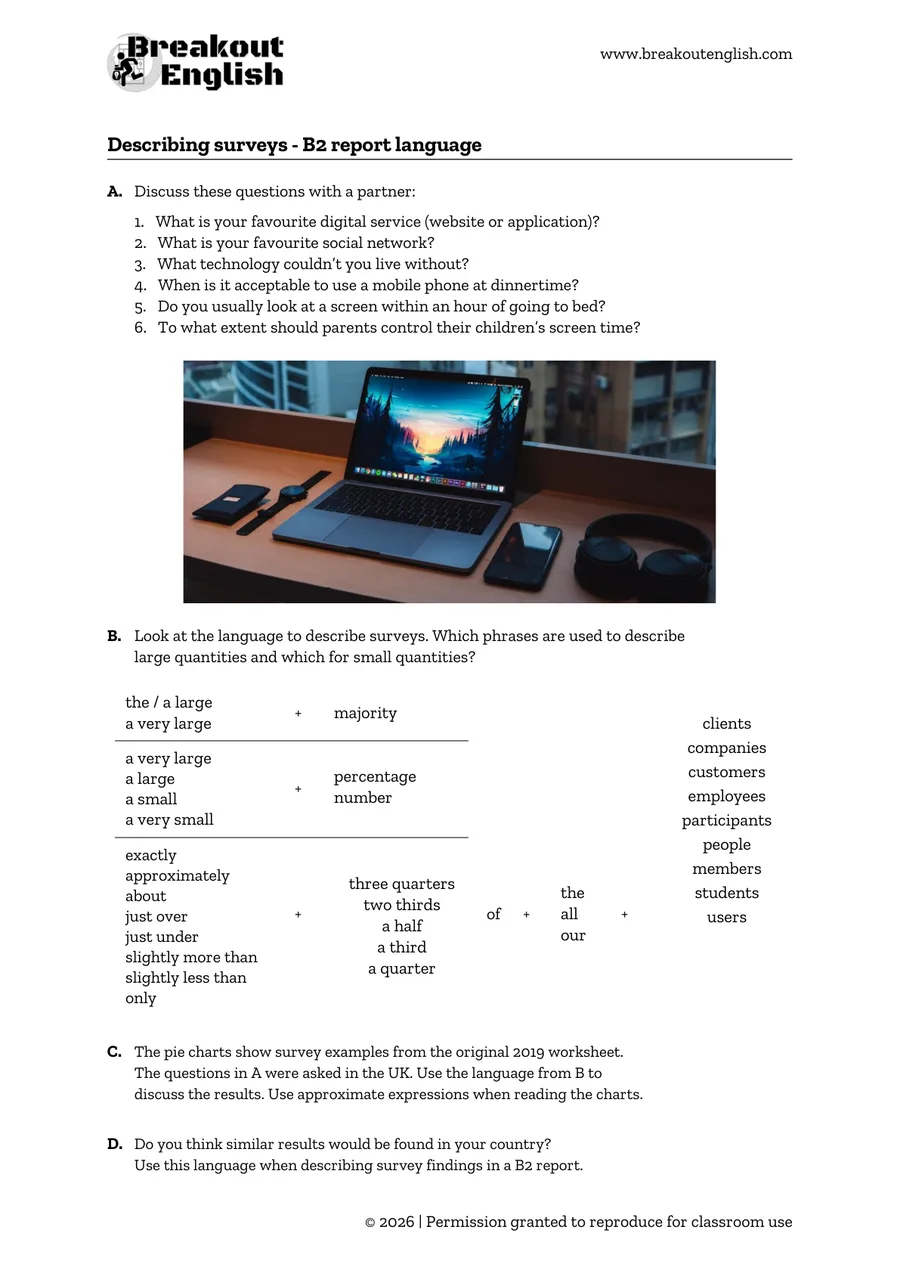
Describing surveys
Surveys and the statistics they provide are the building blocks of a good report. Whatever you need to prove or recommend should be supported by solid evidence.

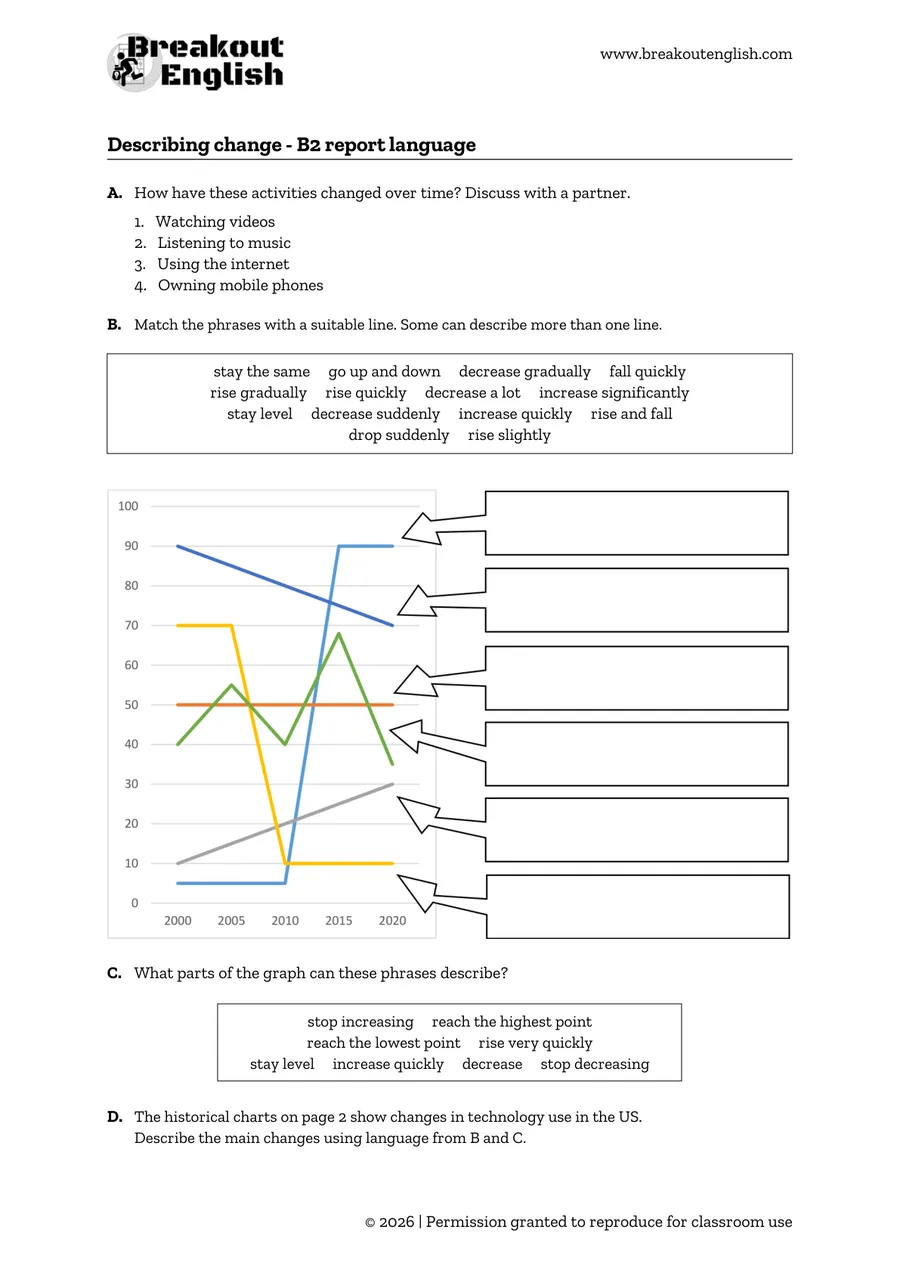
Describing change
Describing change is not only limited to reports. There’s room for this language in essays, formal letters or even articles. It can also help B2 learners explain trends and compare situations in a discussion.
Choose language that describes the change accurately. Mastering it takes practice, but a few useful verbs and adverbs can help your students make their meaning clear.

The materials
Both lessons start out with a quick chat to introduce the topic of technology and change. They then work on the target language before discussing charts and graphs about technology using the language.
The data is slightly adapted, but real. It’s taken from YouGov, a British public opinion and data company, and a Washington Post article on technology trends.
I’ve split up the describing surveys and describing change language. There’s quite a lot of language to take in, so be aware of how much your students can handle before throwing it all at them.
A fun follow-up from describing change language is to have students create their own graphs about whatever topics you can brainstorm as a class. They then have to describe the graphs to their partner who attempts to draw them based on the description.
Following this lesson, give your students a B2 First report task. Ask them to write 140–190 words, organise their findings under headings and finish with a relevant recommendation. The charts are classroom support for practising report language.
EXAM PART: B2 First Writing Part 2: reports
EXAM SKILLS: Describe change and survey findings, organise information, make recommendations and write for a specified audience
TOPIC: Technology
TIME: 30-45 minutes per worksheet
PREPARATION: One copy of the worksheet per student, charts and graphs could be projected rather than printed
Download

Preview